How to create a simple hierarchy chart in d3 js

This is tutorial is for the absolute beginners, if you understand the code by just looking into without reading documentation, please free feel to skip this tutorial and check out the codesandbox
D3 in an nutshell
d3 is a very powerful library to create data visualizations, it uses SVG to render the visualizations.
D3 uses SVG so first, we need to append SVG in the body.
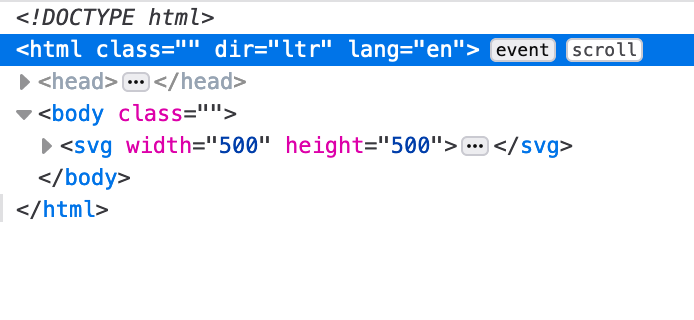
var svg = d3.select("body").append("svg").
.attr("width",500)
.attr("height",500);
This will create an output like these
 Then we need data, and our sample data look like this
var treeData = {
  name: "Javascript Frameworks",
  children: [
    {
      name: "V-DOM Based",
      children: [{ name: "React" }, { name: "Infernov" }],
    },
    {
     name: "DOM Based",
     children: [
        { name: "Angular" },
        { name: "Ember" }
        ]
    },
    { name: "Without DOM" }
  ],
};
This object is needed to convert into hierarchy data, to do that we are using the build-in method called d3-hierarchy
var hierarchyData= d3.hierarchy(treeData);
In d3, we can iterate the array or object by using the .data the method, for that we need to convert the hierarchy data into iterable tree node data
 var treemap = d3.tree().size([500, 500]);

nodes = treemap(hierarchyData);
Now we can iterate the nodes first, we need to group all the path that connect the dots.
var g = svg
  .append("g")
  .attr("transform", "translate(" + margin.left + "," + margin.top + ")");
Each connecting path, we add a class called link
g.selectAll(".link")
  .data(nodes.descendants().slice(1))
  .enter()
  .append("path")
  .attr("class", "link")
  .attr("d", function (d) {
    return (
      "M" +
      d.x +
      "," +
      d.y +
      "C" +
      d.x +
      "," +
      (d.y + d.parent.y) / 2 +
      " " +
      d.parent.x +
      "," +
      (d.y + d.parent.y) / 2 +
      " " +
      d.parent.x +
      "," +
      d.parent.y
    );
  });
We have connecting lines, now we concentrate on the text and circle part.
Create the group tag for both circle and text
var node = g
  .selectAll(".node")
  .data(nodes.descendants())
  .enter()
  .append("g")
  .attr("class", function (d) {
    return "node" + (d.children ? " node--internal" : " node--leaf");
  })
  .attr("transform", function (d) {
    return "translate(" + d.x + "," + d.y + ")";
  });
Create a circle and append it on each node
node.append("circle").attr("r", 6);
For text, we need to take care of the position of text, like if the node has children text should over the circle otherwise need to position at the back of the circle.
node
  .append("text")
  .attr("dy", ".35em")
  .attr("y", function (d) {
    return d.children ? -20 : 20;
  })
  .style("text-anchor", "middle")
  .text(function (d) {
    return d.data.name;
  });
For full please click here
Thanks for reading.
👇 Leave a comment 👇 If you have any question or suggestion.
Leave a ♥️ & 🦄. For more interesting content also check out my Twitter.


